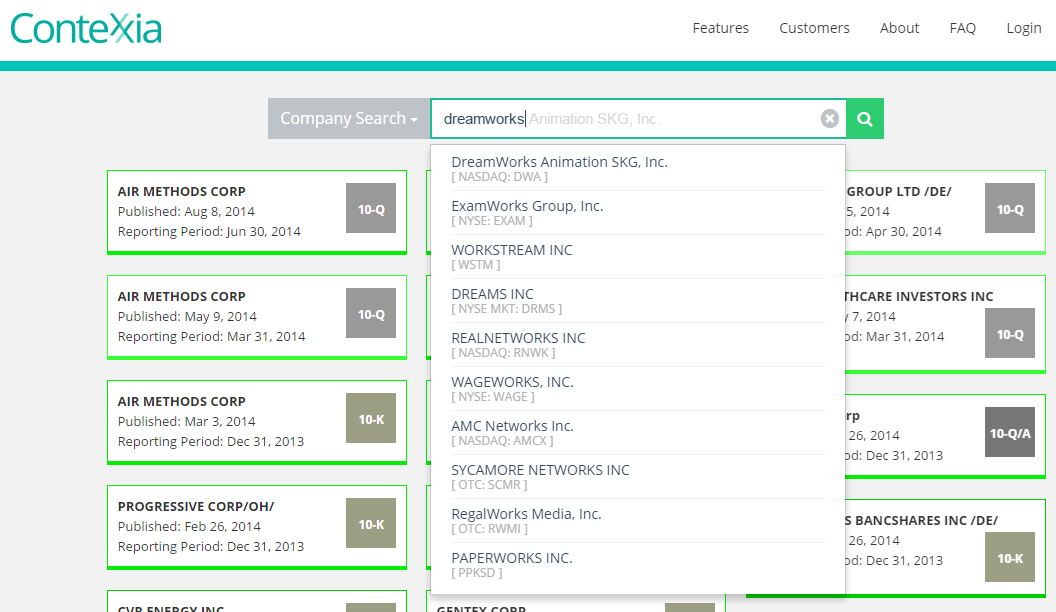
Users can use the Search box located at the top right of the main dashboard page. As you start typing the name of a company, Contexxia will provide a list as shown in the screenshot.
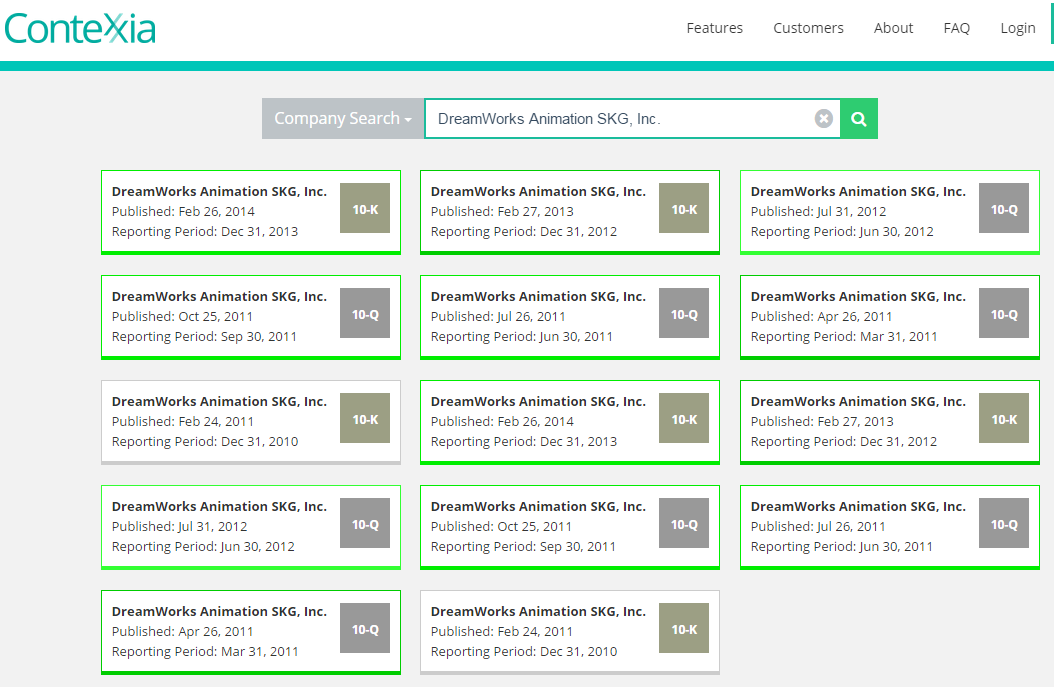
Once you filter down to a particular company using the Search box, Contexxia will show you all available filings for that company. Each filing is represented by one of the rectangular tiles and includes the date on which it was filed (the “Published” date) as well as the Reporting Period. All filings for a company are also accessible from within any of the documents once it is opened. The filings are shown as a list from the "All Available Filings" icon on the top right of the document view page.
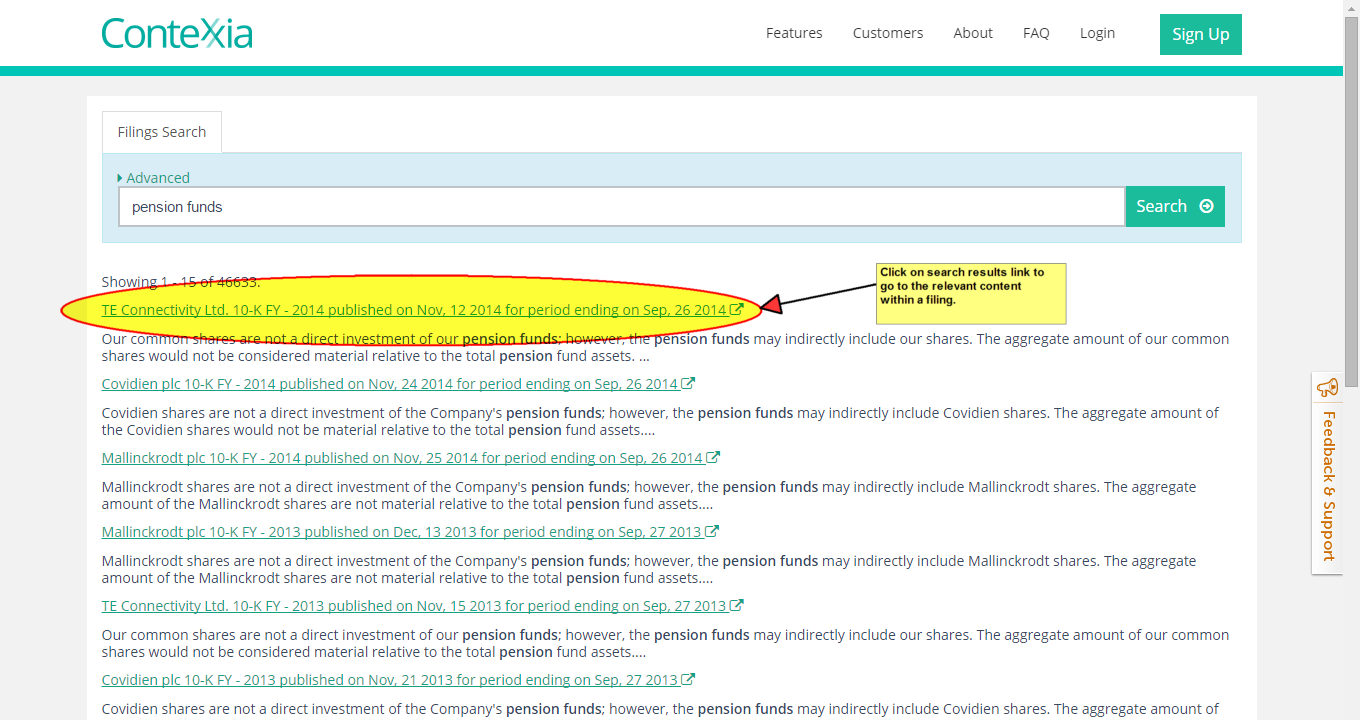
Yes, you can do a text search by selecting the “Text Search” option from the search bar on top.
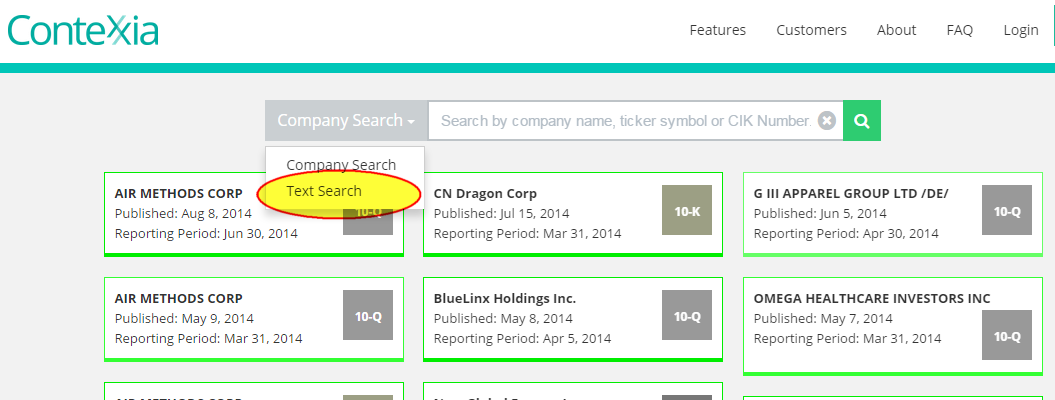
The search results will look like the image below.
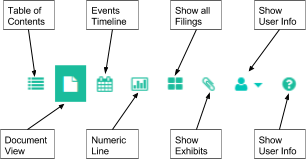
Contexxia provides a set of icons that enable you to analyze and research a document from multiple viewpoints.
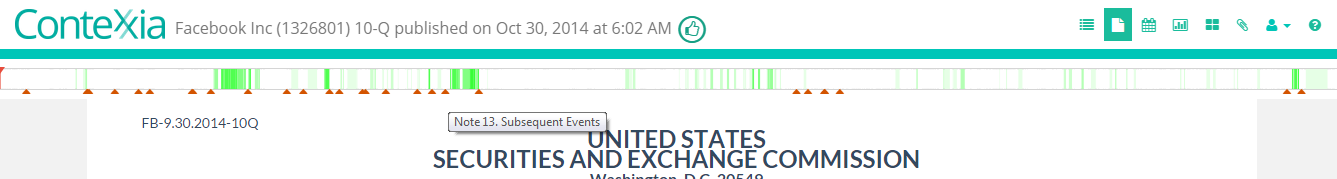
The wide bar with green lines is the Document Index Ribbon and more details are provided in #10. Contexxia opens a document in the Document view. Other views such as Events Timeline View and Numerical Line View are accessible by clicking the icons shown below:
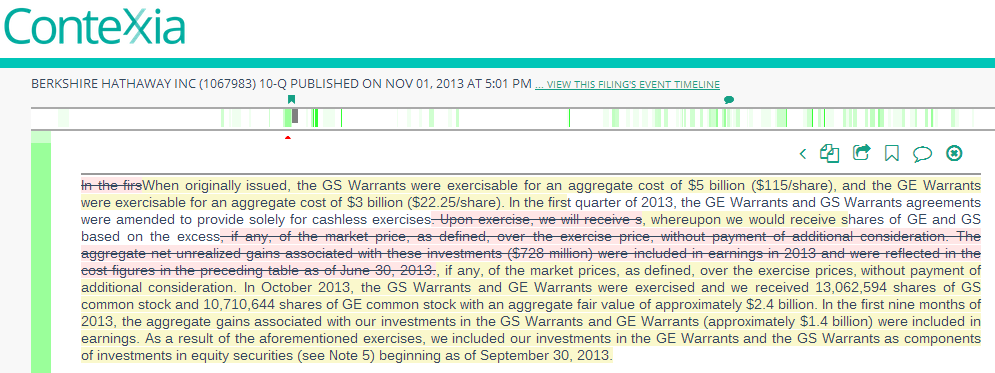
This is the Document Index Ribbon, a powerful tool that shows semantic changes in different parts of the document. You can quickly identify sections of the document that have new content or significant changes by looking at the green bars. The dark green bars indicate new content or substantially changed text while the lighter colors show the smaller content changes. You can very easily see where changes have occurred by looking at the bar rather than scrolling through the entire document. The Document Index Ribbon also enables easy navigation to the specific locations containing these changes by pointing the mouse at a specific green bar. It also show icons where you may have added a bookmark or comment previously.

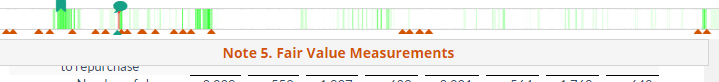
The markers at the bottom of the ribbon indicate the starting locations of various sections within the document. Clicking on any of these markers will pop-up the title of the section. Section titles also show below the ribbon and these change as you scroll through the document to help you easily identify which section of the document you are viewing.
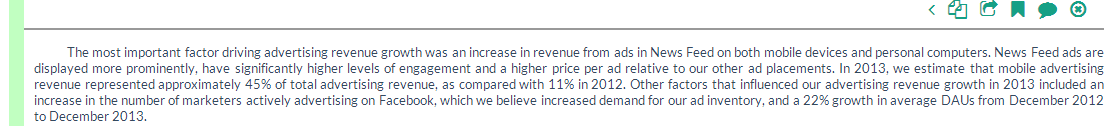
You can click on a paragraph or table that has a green bar to its left. This will open a little toolbar above it that will allow a few new operations. Here’s how the bar looks.
Clicking on the “Compare” icon
![]() will show the changes between the two filings for a specific fragment:
will show the changes between the two filings for a specific fragment:
Yes! Contexxia marks these fragments of text with a blue bar to the left (replacing the normal green color). The blue bars also appear in the index ribbon.
The amount of change is shown by the green bars on the left. If it is dark green, the text is either completely new or substantially changed from the previous filing. When the color is dark green, Contexxia will show a fragment (paragraph or table) from the previous filing that is the nearest semantic match using the “Compare” view. The following colored highlights are used if the text has changed:
a. Pink highlighting shows text that was in the previous document but not in this one
b. Yellow highlighting is new text added in the file being viewed
c. Text with no highlights is identical in both documents

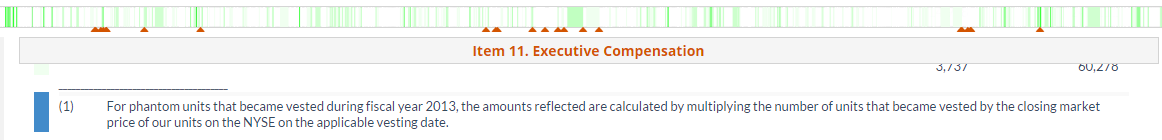
Clicking on the Events icon provides a different visualization of the filing based on all events (dates, periods, etc.) mentioned in a filing. It complements the semantic diff view by providing a unique new way to visually analyze the changes in a filing.
The Events Timeline view shows all events mentioned in a document for specific dates or time periods. It also allows you to navigate using a timeline to view past, present and future events mentioned in the document. Each symbol (arrow, rectangle or circle) may include different shades of green to depict changes to the underlying text. The color shade has the same meaning as in the Semantic Diff view.
The top of the screen shows a timeline navigator indicating years. Users can navigate through the timeline by pointing the mouse at a specific point in time. The various blue shaded sections indicate the presence of an event at a point in time. Dark blue sections show clusters of events at a point in time.
![]()
There are 4 main symbols used in the Events timeline view:
a. Forward Arrow - ![]() -
indicates events from that point in time and going towards the future
-
indicates events from that point in time and going towards the future
b. Backward Arrow - ![]() -
indicates a period ended as of a date and going back in the past
-
indicates a period ended as of a date and going back in the past
c. Circle - ![]() -
represents a specific date
-
represents a specific date
d. Rectangle - ![]() -
represents a range, which could be a few days, months, or years.
-
represents a range, which could be a few days, months, or years.
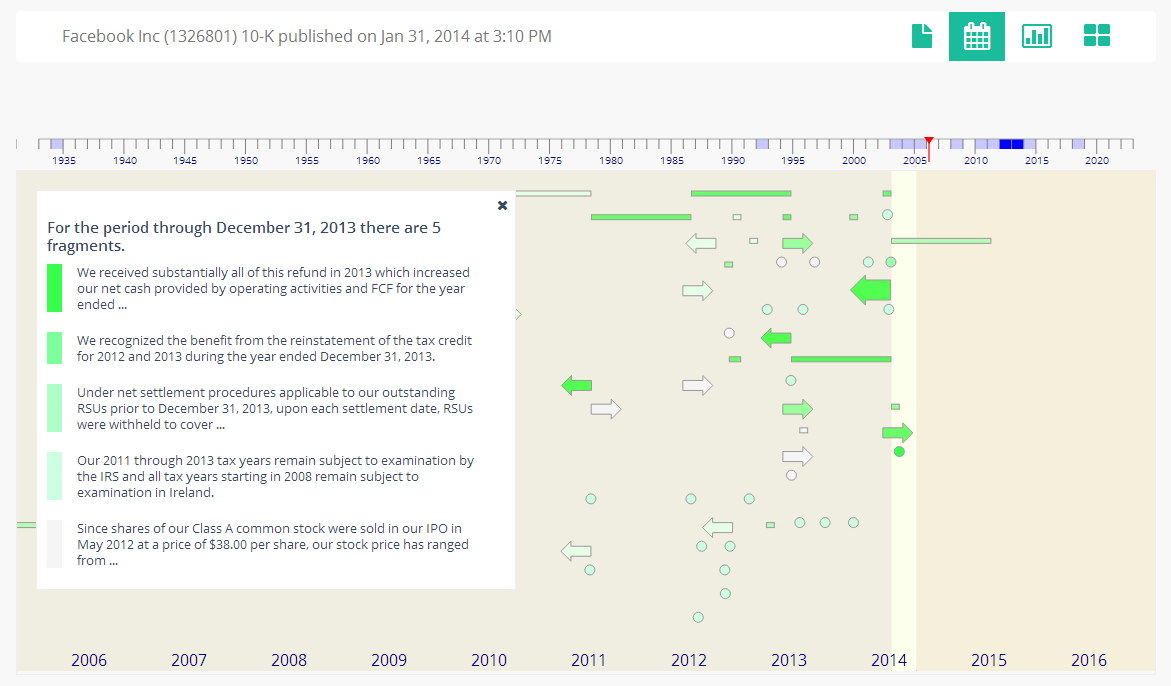
You can click on any of symbols to display a list of references to the event within the document. These will show in a pop-up window on the left of the Events Timeline View. You can scroll through the list as some of the periods or dates may have multiple text fragments associated with them.
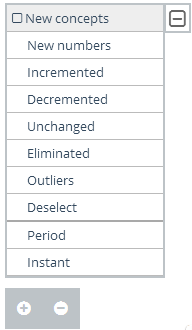
The Numerical Line is the third view provided by Contexxia. It helps you analyze the filing based on the numerical facts presented in the document. The Numerical Line is ordered from left to right based on the biggest facts presented in the document. It provides multiple facets as shown here that enable you to filter the types of facts you wish to analyze. you can also use the Search box to find specific accounting concepts used in the filing.

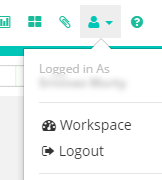
Yes, Contexxia allows you to collect a set of bookmarks and comments to create and save a report. These are available from your user workspace menu which can be accessed by clicking on the user icon on the top right of any of the views as shown in this image.
Yes, all your bookmarks and comments are stored within your workspace. You can access your workspace by clicking on user icon as shown below and selecting “Workspace”.